
Page 92 - JSOM Summer 2023
P. 92
place in a neutral location, a warehouse, where two intel- a text-based simulation using PowerPoint software (control
ligent and interactive avatars played the role of caregivers group) (Figure 1). Five students were absent during the practi-
at the trainee’s disposal to perform either lifesaving proce- cal work, and three questionnaires were not completed.
dures or continuous zonal monitoring.
The participants’ characteristics were similar for mean age
At the conclusion of each of the two scenarios, personal feed- (27.3 vs. 26.8 years; p = .32) and sex ratio (0.36 vs. 0.57;
back was delivered to the trainee. The SG scoring system in- p = .08) in the study and control groups, respectively. The
tegrated time to evacuation, categorization, lifesaving actions, proportion of general practitioner, emergency doctors, and
and teamwork ability (Figure 2). surgeons was not significantly different in both groups (84%,
11%, and 5% vs. 69%, 28%, and 13%, respectively). Con-
Measurements cerning the medical background, during their 3-year residency,
Triage performance was evaluated during the STX (Phase 3) most participants had worked in an emergency department
and assessed by two independent board-certified investigators (35/38 vs. 28/35; p = .13), but few were employed in intensive
using a standard 20-item scale of the FFCCC benchmarks, care units (4/38 vs. 3/35; p = .78) and/or level 1 trauma centers
9-line MEDEVAC request, and time to evacuate the CCP. The (9 vs. 14; p = .13). Where there was a difference in gaming
standard 20-item scale is described in Table 1. By adding the practice between students (20/38 vs. 10/35; p = .003), most
errors made in the five cases, an intervention-specified error reported enjoying computer-based training (69/73) (Table 2).
rate and an overall error rate were reported. Through the
9-line MEDEVAC request at the end of the STX, the trainee TABLE 2 Population Characteristics
announced the categorization of care of the wounded in ac- Study Control
tion: CAT A, Urgent (within 2 hours); CAT B, Priority (within Group Group
4 hours); and CAT C, Routine (within 24 hours). Optimal Factor (N = 38) (N = 35) p-Value
lengths of evacuation for both CAT A and CAT B/C casualties Sex Ratio (F/M) 14/24 20/15 0.08
were evaluated using a 5-point Likert scale. Each trainee was Age 26.8 27.3 0.32
individually debriefed on their performance, quality of simula- General practitioner 32 24 0.14
tion, difficulties, and strengths. GP - EM certificate 3 4 0.62
Residency
The Basal State–Trait Anxiety Inventory was completed at the EM Doctor 1 2 0.52
time of its inclusion in the study, whereas the Acute State–Trait General surgeon 2 5 0.2
Anxiety Inventory was completed before and after the STX. Gaming practice 20 10 0.03
These self-reported questionnaires were anonymized, and a Basal anxiety state 47 47.1 0.61
double-capture method was employed to avoid entry errors EM, emergency medicine; GP, general practitioner
in the database.
Mean duration of a scenario with the SG was 23 minutes, and
Statistical Analysis all students completed at least two scenarios of MCI. The cost
Descriptive analysis was performed to summarize participants’ of this computer-based training was $70 per scenario and per
demographic and experience characteristics. Univariate analy- student, and $780 for the annual software license. For this pi-
sis was used to compare the variables of interest between the lot study, Medusims offered the annual software subscription
two groups, with the Mann-Whitney test for qualitative and and its hardware supply services as compensation for the con-
numeric variables or the chi-squared test to compare two qual- tribution made by FHMS experts. In comparison, text-based
itative variables. A logistic regression was then carried out to simulation using slide presentation (PowerPoint, Microsoft)
consider the confounding factors identified. All of the analyses remained free of cost.
were performed using R software (the R Project for Statistical
Computing, version 3.3.3). A two-sided alpha level of <0.05 Table 2 summarizes the results concerning error rate in FFCCC
was considered statistically significant. completion. The overall error rate in the STX was better for
the study group (p < .001) (Figure 3). There was a tendency
toward significance for a better triage in the study group
Results
(p = .09). All other secondary FFCCC benchmarks were signifi-
Of the 81 postgraduate students at the FMHS Academy, 73 were cantly better in the study group than in the control group exept
included in the TRIAGE study: 38 experienced TRAUMASIMS for bleeding managment and airway assessment for which no
(study group) and 35 performed the laboratory exercises with differences were observed in the two groups (Table 3).
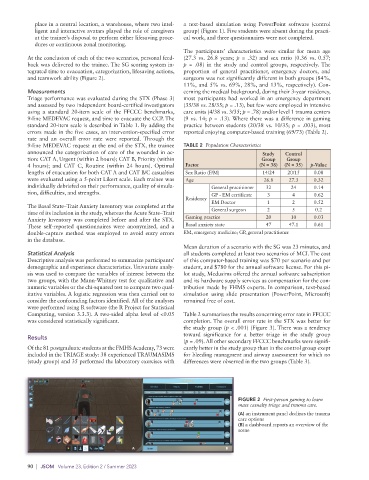
FIGURE 2 First-person gaming to learn
mass casualty triage and trauma care.
(A) an instrument panel declines the trauma
care options
(B) a dashboard reports an overview of the
scene
90 | JSOM Volume 23, Edition 2 / Summer 2023