
Page 67 - JSOM Summer 2023
P. 67
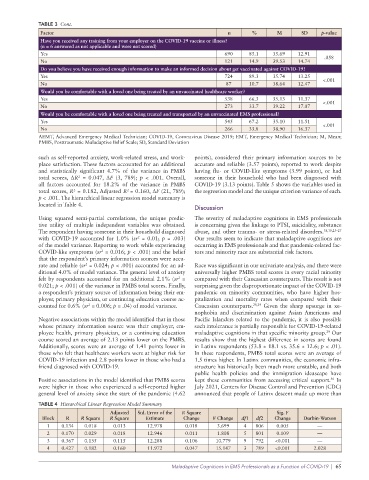
TABLE 3  Cont.
              Factor                                                        n       %       M       SD    p-value
              Have you received any training from your employer on the COVID-19 vaccine or illness?
              (n = 6 answered as not applicable and were not scored)
              Yes                                                         690     85.1    35.69   12.91
                                                                                                           .058
              No                                                          121     14.9    39.53   14.74
              Do you believe you have received enough information to make an informed decision about get vaccinated against COVID-19?
              Yes                                                         724     89.3    35.74   13.25
                                                                                                           <.001
              No                                                           87     10.7    38.64   12.47
              Would you be comfortable with a loved one being treated by an unvaccinated healthcare worker?
              Yes                                                         538     66.3    35.13   11.37
                                                                                                           <.001
              No                                                          273     33.7    39.22   17.07
              Would you be comfortable with a loved one being treated and transported by an unvaccinated EMS professional?
              Yes                                                         545     67.2    35.10   11.51    <.001
              No                                                          266     33.8    38.90   16.37
              AEMT, Advanced Emergency Medical Technician; COVID-19, Coronavirus Disease 2019; EMT, Emergency Medical Technician; M, Mean;
              PMBS, Posttraumatic Maladaptive Belief Scale; SD, Standard Deviation

              such as self-reported anxiety, work-related stress, and work-  points), considered their primary information sources to be
              place satisfaction. These factors accounted for an additional   accurate and reliable (3.57 points), reported to work despite
              and statistically significant 4.7% of the variance in PMBS   having flu- or COVID-like symptoms (3.99 points), or had
              total scores, ΔR  = 0.047, ΔF  (3, 789);  p  < .001. Overall,   someone in their household who had been diagnosed with
                           2
              all factors accounted for 18.2% of the variance in PMBS   COVID-19 (3.13 points). Table 5 shows the variables used in
              total scores, R  = 0.182, Adjusted R = 0.160, ΔF (21, 789);    the regression model and the unique criterion variance of each.
                         2
                                           2
              p < .001. The hierarchical linear regression model summary is
              located in Table 4.
                                                                 Discussion
              Using squared semi-partial correlations, the unique predic-  The severity of maladaptive cognitions in EMS professionals
              tive utility of multiple independent variables was obtained.   is concerning given the linkage to PTSI, suicidality, substance
              The respondent having someone in their household diagnosed   abuse, and other trauma- or stress-related disorders. 18,19,25–27
              with COVID-19 accounted for 1.0% (sr   = 0.01;  p = .003)   Our results seem to indicate that maladaptive cognitions are
                                              2
              of the model variance. Reporting to work while experiencing   occurring in EMS professionals and that pandemic-related fac-
              COVID-like symptoms (sr  = 0.016; p < .001) and the belief   tors and minority race are substantial risk factors.
                                  2
              that the respondent’s primary information sources were accu-
              rate and reliable (sr  = 0.024; p < .001) accounted for an ad-  Race was significant in our univariate analysis, and there were
                             2
              ditional 4.0% of model variance. The general level of anxiety   universally higher PMBS total scores in every racial minority
              felt by respondents accounted for an additional 2.1% (sr  =   compared with their Caucasian counterparts. This result is not
                                                           2
              0.021; p < .001) of the variance in PMBS total scores. Finally,   surprising given the disproportionate impact of the COVID-19
              a respondent’s primary source of information being their em-  pandemic on minority communities, who have higher hos-
              ployer, primary physician, or continuing education course ac-  pitalization and mortality rates when compared with their
              counted for 0.6% (sr  = 0.006; p = .04) of model variance.  Caucasian counterparts. 28,29  Given the sharp upsurge in xe-
                              2
                                                                 nophobia and discrimination against  Asian  Americans and
              Negative associations within the model identified that in those   Pacific Islanders related to the pandemic, it is also possible
              whose primary information source was their employer, em-  such intolerance is partially responsible for COVID-19-related
              ployee health, primary physician, or a continuing education   maladaptive cognitions in that specific minority group.  Our
                                                                                                            29
              course scored an average of 2.13 points lower on the PMBS.   results show that the highest difference in scores are found
              Additionally, scores were an average of 1.41 points lower in   in Latinx respondents (53.8 ± 18.1 vs. 35.6 ± 12.6; p < .01).
              those who felt that healthcare workers were at higher risk for   In these respondents, PMBS total scores were an average of
              COVID-19 infection and 2.8 points lower in those who had a   1.5 times higher. In Latinx communities, the economic infra-
              friend diagnosed with COVID-19.                    structure has historically been much more unstable, and both
                                                                 public  health policies  and  the immigration  ideascape  have
              Positive associations in the model identified that PMBS scores   kept these communities from accessing critical support.  In
                                                                                                             30
              were higher in those who experienced a self-reported higher   July 2021, Centers for Disease Control and Prevention (CDC)
              general level of anxiety since the start of the pandemic (4.62   announced that people of Latinx descent made up more than
              TABLE 4  Hierarchical Linear Regression Model Summary
                                     Adjusted    Std. Error of the   R Square               Sig. F
               Block   R   R Square  R Square    Estimate    Change    F Change  df1  df2  Change   Durbin-Watson
                1    0.134   0.018    0.013      12.978       0.018     3.699    4   806   0.005         —
                2    0.170   0.029    0.018      12.946       0.011     1.808    5   801   0.109         —
                3    0.367   0.135    0.115      12.288       0.106     10.779   9   792   <0.001        —
                4    0.427   0.182    0.160      11.972       0.047     15.147   3   789   <0.001       2.028

                                                         Maladaptive Cognitions in EMS Professionals as a Function of COVID-19  |  65