
Page 68 - 2022 Spring JSOM
P. 68
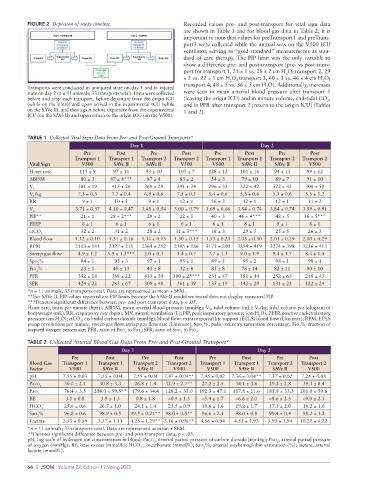
FIGURE 2  Depiction of study timeline.             Recorded values pre- and post-transport for vital sign data
                                                             are shown in Table 1 and for blood gas data in Table 2; it is
                                                             important to note that values for preTransport1 and preTrans-
                                                             port3 were collected while the animal was on the V500 ICU
                                                             ventilator, serving as “gold standard” measurements as stan-
                                                             dard of care therapy. The PIP limit was the only variable to
                                                             show a difference pre- and post-transport (pre- vs post-trans-
                                                             port for transport 1, 21 ± 1 vs. 28 ± 2 cm H O; transport 2, 29
                                                                                              2
                                                             ± 2 vs. 22 ± 1 cm H O; transport 3, 40 ± 3 vs. 46 ± 4 cm H O;
                                                                            2
                                                                                                          2
                                                             transport 4, 48 ± 5 vs. 36 ± 5 cm H O). Additionally, increases
          Transports were conducted in uninjured state on day 1 and in injured          2
          state on day 2 (n = 11 animals; 33 transports total). Data were collected   were seen in mean arterial blood pressure after transport 1
          before and after each transport, before departure from the origin ICU   (leaving the origin ICU) and in minute volume, end-tidal CO ,
                                                                                                            2
          (while on the V500) and upon arrival in the experimental ICU (while   and in PFR after transport 2 (return to the origin ICU) (Tables
          on the SAVe II), and then again before departure from the experimental   1 and 2).
          ICU (on the SAVe II) and upon return to the origin ICU (on the V500).
          TABLE 1  Collected Vital Signs Data From Pre- and Post-Ground Transports*
                                            Day 1                                     Day 2
                             Pre       Post       Pre       Post       Pre       Post       Pre       Post
                          Transport 1  Transport 1  Transport 2  Transport 2  Transport 1  Transport 1  Transport 2  Transport 2
           Vital Sign       V500      SAVe II    SAVe II    V500      V500      SAVe II    SAVe II    V500
           Heart rate      115 ± 9    97 ± 11    93 ± 10   105 ± 7   128 ± 12  101 ± 16    94 ± 13   99 ± 12
           ABP/M           80 ± 3    87 ± 4***   87 ± 4     83 ± 2    54 ± 3    79 ± 10    89 ± 7    91 ± 10
           V T             381 ± 19   415 ± 26  369 ± 29   391 ± 24  296 ± 33  322 ± 42   322 ± 42   308 ± 50
           V /kg           7.3 ± 0.3  7.7 ± 0.4  6.9 ± 0.6  7.5 ± 0.5  5.4 ± 0.6  5.3 ± 0.6  5.3 ± 0.6  5.5 ± 1.2
            T
           RR               9 ± 1     10 ± 1      9 ± 1     12 ± 1    16 ± 3    12 ± 1     12 ± 1     11 ± 2
           V              3.71 ± 0.37  4.10 ± 0.47  3.48 ± 0.54  5.00 ± 0.79  3.69 ± 0.66  3.84 ± 0.74  3.84 ± 0.74  3.59 ± 0.91
            E
           PIP**           21 ± 1    28 ± 2***   29 ± 2     22 ± 1    40 ± 3   46 ± 4***   48 ± 5   36 ± 5***
           PEEP             6 ± 1      6 ± 1      6 ± 1     6 ± 1     6 ± 1      8 ± 1     8 ± 1      8 ± 1
           etCO            32 ± 2     31 ± 2     28 ± 2   31 ± 3***   18 ± 3    29 ± 5     25 ± 5     26 ± 3
              2
           Blood flow     1.12 ± 0.10  1.31 ± 0.16  1.34 ± 0.15  1.30 ± 0.15  1.53 ± 0.23  2.03 ± 0.30  2.01 ± 0.29  2.00 ± 0.29
           RPM            2103 ± 181  2327 ± 211  2364 ± 212  2185 ± 186  3171 ± 200  3254 ± 419  3274 ± 398  3256 ± 413
           Sweep gas flow  4.9 ± 1.2  5.9 ± 1.3***  2.0 ± 0.3  1.4 ± 0.7  7.7 ± 1.3  9.0 ± 1.9  9.4 ± 1.7  8.4 ± 1.0
           Spo %           94 ± 1     95 ± 3     97 ± 1     95 ± 1    89 ± 5    95 ± 2     98 ± 1     98 ± 1
             2
           Fio %           23 ± 1     49 ± 13    43 ± 8     32 ± 8    85 ± 8    78 ± 14    82 ± 11   90 ± 10
             2
           PFR             342 ± 18   388 ± 22  433 ± 30  380 ± 25***  231 ± 47  181 ± 44  252 ± 63  218 ± 43
           SFR            424 ± 22    283 ± 67  309 ± 48   361 ± 39  135 ± 19  142 ± 29   131 ± 21   122 ± 24
          *n = 11 animals; 33 transports total. Data are represented as mean ± SEM.
          **For SAVe II, PIP values reported are PIP limits because the SAVe II model we tested does not display measured PIP.
          ***Denotes significant difference between pre- and post-transport data, p < .05.
          Heart rate, beats per minute (bpm); ABP/M, mean arterial blood pressure (mmHg); V , tidal volume (mL); V /kg, tidal volume per kilogram of
                                                                     T
                                                                                     T
          bodyweight (mL); RR, respiratory rate (bpm); MV, minute ventilation (L); PIP, peak inspiratory pressure (cm H O); PEEP, positive end-expiratory
                                                                                      2
          pressure (cm H O); etCO , end-tidal carbon dioxide (mmHg); blood flow: extracorporeal life support (ECLS) blood flow (L/minute); RPM, ECLS
                    2
                           2
          pump revolutions per minute; sweep gas flow, sweep gas flow rate (L/minute); Spo %, pulse oximetry saturation percentage; Fio %: fraction of
                                                                                                   2
                                                                   2
          inspired oxygen percentage; PFR, ratio of Pao  to Fio ; SFR, ratio of Spo  to Fio .
                                          2    2            2    2
          TABLE 2  Collected Arterial Blood Gas Data From Pre- and Post-Ground Transport*
                                         Day 1                                       Day 2
                        Pre         Post       Pre        Post       Pre        Post       Pre        Post
           Blood Gas   Transport 1  Transport 1  Transport 2  Transport 2  Transport 1  Transport 1  Transport 2  Transport 2
           Factor       V500       SAVe II    SAVe II     V500       V500      SAVe II    SAVe II     V500
           pH         7.55 ± 0.03  7.55 ± 0.04  7.55 ± 0.04  7.47 ± 0.04**  7.45 ± 0.02  7.36 ± 0.04**  7.37 ± 0.02  7.28 ± 0.08
           Paco       30.0 ± 2.1  30.8 ± 3.3  26.8 ± 1.4  32.9 ± 2.7**  27.2 ± 2.5  34.1 ± 3.6  29.2 ± 2.8  39.3 ± 8.4
              2
           Pao 2      76.4 ± 3.5  204.0 ± 59.5**  179.6 ± 34.4  128.2 ± 33.0  192.3 ± 47.1  117.8 ± 11.6  185.8 ± 33.3  201.0 ± 50.6
           BE         3.1 ± 0.8   3.9 ± 1.3  0.8 ± 1.8  –0.4 ± 1.3  –5.4 ± 1.7  –6.6 ± 2.0  –8.6 ± 2.3  –9.0 ± 2.3
           HCO  –     25.6 ± 0.6  26.7 ± 1.0  24.1 ± 1.4  23.5 ± 0.9  18.6 ± 1.6  19.2 ± 1.7  17.3 ± 2.0  18.2 ± 1.6
              3
           Sao %      96.8 ± 0.6  98.9 ± 0.5  99.5 ± 0.21**  98.0 ± 0.5**  96.6 ± 2.1  98.0 ± 0.8  99.4 ± 0.4  98.2 ± 1.2
             2
           Lactate    2.53 ± 0.59  3.57 ± 1.11  4.23 ± 1.29** 3.16 ± 0.96**  4.56 ± 0.94  4.55 ± 1.93  5.93 ± 1.94  10.22 ± 4.22
          *n = 11 animals; 33 transports total. Data are represented as mean ± SEM.
          **Denotes significant difference between pre- and post-transport data, p < .05.
          pH, log scale of hydrogen ion concentration in blood; Paco , arterial partial pressure of carbon dioxide (mmHg); Pao , arterial partial pressure
                                                                                           2
                                                   2
                                               –
          of oxygen (mmHg); BE, base excess (mmol/L); HCO , bicarbonate (mmol/L); Sao %, arterial oxyhemoglobin saturation (%); lactate, arterial
                                                                    2
                                               3
          lactate (mmol/L).
          66  |  JSOM   Volume 22, Edition 1 / Sping 2022