
Page 76 - JSOM Fall 2019
P. 76
method strayed from the prescribed technique, it was anno- Results
tated by the AIs. Raters were given specific guidelines as to
which deviations from method could be accepted and which Table 3 shows summary statistics. For the 32 participants
could not and would therefore be disqualified. No markings completing 64 iterations, the study revealed an absolute differ-
were disqualified based on the criteria agreed on prestudy. ence of 37%, favoring the TM. In addition to overall success,
the TM was more accurate than the LHM when vertical and
Following each marking, success and accuracy were verified horizontal CTM parameters were analyzed separately. The
and recorded (from midline and past the superior and infe- TM was consistently faster than the LHM.
rior borders, if applicable) by the two AIs. The measurements
were recorded in millimeters via a digital caliper (Neiko, ASIN TABLE 3 Summary Statistics
B000GSLKIW, ordered from www.amazon.com). After mea- Primary outcome LHM TM p Cohen
surements were recorded on the back of the numbered demo- Successful markings 13 (41%) 25 (78%) .002 h = .38
graphic/results sheets, the study participants’ markings were Secondary outcomes
wiped off the transparent adhesive but the objective CTM Distance past borders 1.8 ±3.4 -0.4 ± 4.5 .021 n/a
borders and midline, under the adhesive dressing, remained (mm)
throughout the study as originally marked. There was a Distance from midline 2.6 ± 2 2.6 ± 2 .934 d = 0
6-minute washout period between participants marking their (mm)
first and second models. This was an arbitrary number chosen Time to completion 24 ± 10 18 ± 9 .007 d = .52
due to population time constraints. Following the washout pe- (sec)
riod, participants alternated methods and models. Participant Additional statistics
interaction is summarized in Figure 6. The order of method Within upper/ 15 (47%) 25 (78%) .009 h = .32
per subject is shown in Table 2. lower borders
Within 5mm midline 26 (81%) 32 (100%) .003 h = .45
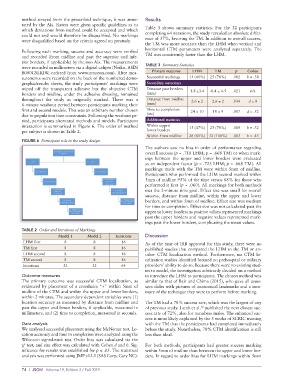
FIGURE 6 Participant role in the study design.
The authors saw no bias in order of performance regarding
overall success (p = .718 LHM; p = .668 TM) or when mark-
ings between the upper and lower borders were evaluated
as an independent factor (p = .723 LHM; p = .668 TM). All
markings made with the TM were within 5mm of midline.
Participants who performed the LHM second marked within
5mm of midline 93% of the time versus 68% for those who
performed it first (p = .060). All markings for both methods
met the 2-minute time goal. Effect size was small for overall
success, distance from midline, within the upper and lower
borders, and within 5mm of midline. Effect size was medium
for time to completion. Effect size was not calculated past the
upper or lower borders as positive values represented markings
past the upper borders and negative values represented mark-
ings past the lower borders, complicating the mean values.
TABLE 2 Order and Iterations of Markings
Model 1 Model 2 Iterations Discussion
LHM first 8 8 16 As of the time of IRB approval for this study, there were no
TM first 8 8 16 published studies that compared the LHM to the TM or an-
LHM second 8 8 16 other CTM localization method. Furthermore, no CTM lo-
TM second 8 8 16 calization studies identified focused on prehospital or military
Iterations 32 32 64 providers’ ability to do so. Because there were no existing stud-
ies to model, the investigators arbitrarily decided on a method
Outcome measures to introduce the LHM to participants. The chosen method was
The primary outcome was successful CTM localization, as similar to that of Bair and Chima (2015), who gave all asses-
evidenced by placement of a crosshairs “+” within 5mm of sors slides with pictures of anatomical landmarks and a sum-
midline of the CTM and within the upper and lower borders, mary of the technique they were to perform before marking.
within 2 minutes. The secondary dependent variables were (1)
location accuracy as measured by distance from midline and The TM had a 78% success rate, which was the largest of any
past the upper and lower borders, if applicable, measured in of previous study. Lamb et al. published the next closest suc-
10
millimeters, and (2) time to completion, measured in seconds. cess rate of 72%, also for nonobese males. The enhanced suc-
cess is most likely explained by the 5 weeks of SCRIC training
Data analysis with the TM that the participants had completed immediately
We analyzed successful placement using the McNemar test. Lo- before the study. Nonetheless, 78% CTM identification is still
cation accuracy and time to completion were analyzed using the less than ideal.
Wilcoxon signed-rank test. Order bias was calculated via the
χ test, and size effect was calculated with Cohen d and h. Sig- For both methods, participants had greater success marking
2
nificance for results was established for p ≤ .05. The statistical within 5mm of midline than between the upper and lower bor-
analysis was performed using JMP v13.1 (SAS Corp, Cary NC). ders. In regard to order bias for LHM markings within 5mm
74 | JSOM Volume 19, Edition 3 / Fall 2019