
Page 49 - JSOM Fall 2019
P. 49
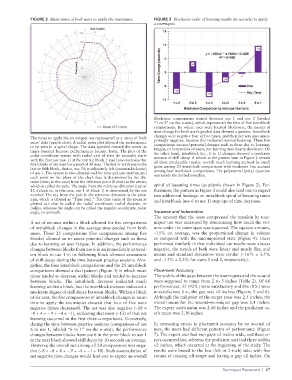
FIGURE 2  Mean times of both users to apply the tourniquet.  FIGURE 3  Blockwise order of learning results (in seconds) to apply
                                                                 a tourniquet.


                                                                 Blockwise comparisons started between use 1 and use 2 (labeled
                                                                 “1 to 2” on the x-axis), which represented the first of five intrablock
                                                                 comparisons. By where uses were located blockwise, the means of
                                                                 time change for both user’s pooled data showed a pattern. Intrablock
              The times to apply the tourniquet are represented as a mean of both   changes were negative four of five times, and their net was also unsur-
              users’ data (purple dots). A radial polar plot allowed the performance   prisingly negative, because this indicated normal learning. These five
              to be seen in a spiral shape. The data spiraled toward the center as   comparisons assessed potential changes such as those due to learning,
              times lessened because performances became faster. The plot of the   fatigue, or inattention of users, but learning was clearly dominant. On
              polar coordinate system with radial axis of time (in seconds) starts   the other hand, interblock (i.e., 6 to 1) changes showed a moderate
              with the first use (use 1) at the top for block 1 and runs clockwise for   amount of skill decay. A relook at the pattern seen in Figure 2 reveals
              five blocks of six uses for a total of 30 uses. The last or sixth use in the   all these predictable results: overall much learning accrued by small
              last or fifth block, that is, use 30, is adjacently left (counterclockwise)   gains among 25 intrablock comparisons with moderate loss accrued
              of use 1. The system is two-dimensional for time and use number, and   among four interblock comparisons. The polynomial (poly.) equation
              each point on the plane of the clock face is determined by the dis-  represents the dotted trendline.
              tance (time, in this case) from the reference point (0 time) at the center,
              which is called the pole. The angle from the reference direction (top or   spiral of lessening times (as plainly shown in Figure 2). Fur-
              12 o’clock or, in this case, use 1 of block 1) is determined by the use   thermore, the pattern in Figure 3 could also lead one to expect
              number. The ray from the pole in the reference direction is the polar   two additional findings: an intrablock spiral of lessening times
              axis, which is labeled as “Time (sec).” The time value of the mean as   and interblock (use 6 to use 1) step-ups of time increases.
              plotted can also be called the radial coordinate, radial distance, or
              radius, whereas the angle can be called the angular coordinate, polar
              angle, or azimuth.                                 Squeeze and Indentation
                                                                 The amount that the users compressed the manikin by tour-
              A set of six uses within a block allowed for five comparisons   niquet use was measured by determining how much the vol-
              of intrablock changes in the average time pooled from both   ume under the tourniquet was squeezed. The squeeze amount,
              users. These 25 comparisons (five comparisons among five   −15% on average, was  the proportional change in volume
              blocks) allowed us to assess potential changes such as those   as  compared  with  the  uncompressed  state  (Figure  4).  Users
              due to learning or user fatigue. In addition, the performance   performed similarly in that individual use results were always
              changes between blocks from use 6 in an immediately anteced-  negative, the trends of both were linear and nearly flat, and
              ent block to use 1 in its following block allowed assessment   means and standard deviations were similar (−16% ± 3.5%
              of skill decay during the time between practice sessions. Alto-  and −15% ± 2.2% for users 1 and 2, respectively).
              gether, the four intrablock comparisons and the 25 interblock
              comparisons showed a dual pattern (Figure 3) in which mean   Placement Accuracy
              times tended to decrease within blocks and tended to increase   The widths of the gaps between the tourniquets and the wound
              between blocks. The intrablock decrease  indicated much   were supposed to range from 2 to 3 inches (Table 2). Of 60
              learning within a block, but the interblock increase indicated a   performances, 55 (92%) were satisfactory and five (8%) were
              moderate degree of skill decay between blocks. Within a block   unsatisfactory (i.e., the gap was <2 inches; (Figures 5 and 6).
              of six uses, the five comparisons of intrablock changes in mean   Although the midpoint of the target zone was 2.5 inches, the
              time to apply the tourniquet showed that four of five were   overall mean for the wound–tourniquet gap was 2.4 inches.
              negative (times decreased). The net was also negative (−18 =   The expert user’s mean was 2.46 inches and the proficient us-
              −8 + 4 + − 9 + −4 + −1), indicating that most (−13) of that net   er’s mean was 2.36 inches.
              learning occurred in the first three comparisons. Conversely,
              during the time between practice sessions (comparison of use   In measuring errors in placement accuracy by an accrual of
              6 to use 1, labeled “6 to 1” on the x-axis), the performance   uses, the users had different patterns of performance (Figure
              changes between blocks from use 6 in the prior block to use 1   7). The expert user had two gaps <2 inches wide, and these er-
              in the next block showed skill decay by 10 seconds on average.   rors occurred late, whereas the proficient user had three widths
              However, the overall net among all 29 comparisons was nega-  <2 inches, which occurred at the beginning of the study. The
              tive (−8 = −8 + 4 + − 9 + −4 + −1 + 10). Such accumulation of   results were biased to the low (left or 2-inch) side, with five
              net negative time changes would lead one to expect an overall   counts of missing off-target and having a gap <2 inches. On

                                                                                             Tourniquet Placement  |  47