
Page 120 - JSOM Summer 2018
P. 120
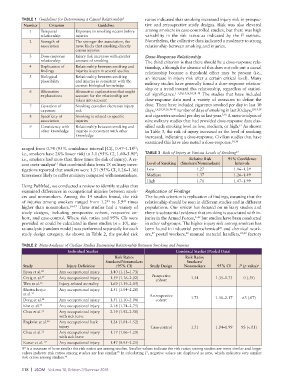
TABLE 1  Guidelines for Determining a Causal Relationship 2  ratios indicated that smoking increased injury risk in prospec-
           Number    Criterion           Guideline           tive and retrospective study designs. Risk was also elevated
             1    Temporal      Exposure to smoking occurs before   among smokers in case-controlled studies, but there was high
                  relationship  injuries                     variability in the risk ratios as indicated by the  I  statistic.
                                                                                                     2
             2    Strength of   The stronger the association, the   Nonetheless, the collective data indicated a moderate to strong
                  association   more likely that smoking directly   relationship between smoking and injuries.
                                causes injuries
             3    Dose-response   Injury risk increases with greater   Dose-Response Relationship
                  relationship  amount of smoking            The third criterion is that there should be a dose-response rela-
             4    Replication of   Relationship between smoking and   tionship, although the absence of this does not rule out a causal
                  findings      injuries is seen in several studies  relationship because a threshold effect may be present (i.e.,
             5    Biological    Relationship between smoking   an increase in injury risk after a certain critical level). Many
                  plausibility  and injuries is consistent with the   military studies have generally found a dose-response relation-
                                current biological knowledge
             6    Alternative   Alternative explanations that might   ship or a trend toward this relationship, regardless of statisti-
                                                                         5–7,10,14,16,18,38–40
                  explanations  account for the relationship are   cal significance.   The studies that have included
                                taken into account           dose-response data used a variety of measures to define the
             7    Cessation of   Smoking cessation decreases injury   dose. These have included cigarettes smoked per day in last 30
                  exposure      risk                         days, 5,6,10,14,16,38–40  number of days of smoking in last 30 days, 10,14,38
             8    Specificity of   Smoking is related to specific   and cigarettes smoked per day in last year. 7,18  A meta-analysis of
                  association   injuries                     nine military studies that had provided dose-response data clas-
                                                                                                    15
             9    Consistency with   Relationship between smoking and   sified each smoking level as low, medium, or high.  As shown
                  other knowledge  injuries is consistent with other   in Table 3, the risk of injury increased as the level of smoking
                                knowledge                    increased, indicating a dose-response. Civilian studies that have
                                                             examined this have also noted a dose-response. 30,36
          ranged from 0.74 (95% confidence interval [CI], 0.47–1.18 ;
                                                        23
          i.e., smokers have 26% lower risk) to 3.1 (95% CI, 1.60–5.90 ;   TABLE 3  Risk of Injury at Various Levels of Smoking 15
                                                         7
          i.e., smokers had more than three times the risk of injury). A re-   Relative Risk   95% Confidence
          cent meta-analysis  that combined data from 18 military inves-  Level of Smoking  (Smokers/Nonsmokers)  Intervals
                        15
          tigations reported that smokers were 1.31 (95% CI, 1.26–1.36)   Low     1.27            1.16–1.39
          times more likely to suffer an injury compared with nonsmokers.  Medium  1.37           1.26–1.49
                                                              High                1.71            1.47–1.99
          Using PubMed, we conducted a review to identify studies that
          examined differences in occupational injuries between smok-  Replication of Findings
          ers and nonsmokers. Among the 14 studies found, the risk   The fourth criterion is replication of findings, meaning that the
          of injuries among smokers ranged from 1.2  to 5.9  times   relationship should be seen in different studies and in different
                                             24
                                                    25
          higher than nonsmokers. 24–37  These studies had a variety of   populations. Our review has focused on military studies and
          study designs, including prospective cohort, respective co-  there is substantial evidence that smoking is associated with in-
          hort, and case-control. Where risk ratios and 95% CIs were   juries in the Armed Forces, 5–22  but studies have been conducted
          provided or could be calculated in these studies (n = 10), me-  in other subgroups. The higher injury risk among smokers has
          ta-analysis (random model) was performed separately for each   been found in industrial petrochemical  and chemical work-
                                                                                            26
          study design category. As shown in Table 2, the pooled risk   ers,  postal workers,  manual material handlers, 25,29  factory
                                                                27
                                                                              28
          TABLE 2  Meta-Analyses of Civilian Studies Examining Relationship Between Smoking and Injuries
                             Individual Studies                           Combined Studies (Pooled Data)
                                                Risk Ratio:                   Risk Ratio:
                                             Smokers/Nonsmokers               Smokers/
                                                                                                    2
           Study             Injury Definition   (95% CI)      Study Design  Nonsmokers    95% CI   I  (p value) a
           Ryan et al. 28  Any occupational injury  1.40 (1.13–1.73)
           Craig et al. 29  Any occupational injury  1.59 (1.16–2.02)  Prospective   1.54  1.35–1.73  0 (.39)
                                                                 cohort
           Wen et al. 36  Injury-related mortality  1.69 (1.39–2.05)
           Bhattacherjee    Any occupational injury  1.51 (1.04–2.20)
           et al. 35                                           Retrospective
           Dong et al.    Any occupational injury  1.51 (1.10–2.08)  cohort     1.73      1.30–2.17  63 (.07)
                  34
           Kim et al. 25  Any occupational injury  2.18 (1.74–2.75)
           Chau et al. 33  Any occupational injury   2.19 (1.92–2.50)
                          with sick leave
           Engkvist et al. 24  Any occupational back   1.24 (1.01–1.52)
                          injury                               Case-control     1.51      1.04–1.99  93 (<.01)
           Chau et al. 32  Any occupational injury   1.17 (1.06–1.29)
                          with sick leave
           Kunar et al.  37  Any occupational injury  1.47 (0.95–2.25)
           I  is a measure of how similar the risk ratios are among studies. Smaller values indicate the risk ratios among studies are more similar and larger
          a 2
                                                 95
          values indicate risk ratios among studies are less similar.  In calculating I , negative values are displayed as zero, which indicates very similar
                                                              2
          risk ratios among studies. 96
          118  |  JSOM   Volume 18, Edition 2/Summer 2018