
Page 50 - Journal of Special Operations Medicine - Fall 2016
P. 50
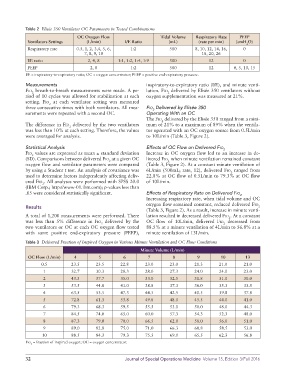
Table 2  Elisée 350 Ventilator OC Parameters in Tested Combinations
                                  OC Oxygen Flow                     Tidal Volume    Respiratory Rate    PEEP
             Ventilators Settings     (L/min)         I/E Ratio         (mL)         (rate per min)  (cmH O)
                                                                                                         2
             Respiratory rate    0.5, 1, 2, 3,4, 5, 6,   1:2             500       8, 10, 12, 14, 16,   0
                                     7, 8, 9, 10                                      18, 20, 26
             I/E ratio                2, 4, 8      1:1, 1:2, 1:4, 1:9    500             12             0
             PEEP                      2, 8             1:2              500             12         0, 5, 10, 15
            I/E = inspiratory-to-expiratory ratio; OC = oxygen concentrator; PEEP = positive end-expiratory pressure.

            Measurements                                       inspiratory-to-expiratory ratio (I/E), and minute venti-
            Fio  breath-to-breath measurements were made. A pe-  lation. Fio  delivered by Elisée 350 ventilators without
               2
                                                                        2
            riod of 10 cycles was allowed for stabilization at each   oxygen supplementation was measured at 21%.
            setting. Fio  at each ventilator setting was measured
                      2
            three consecutive times with both ventilators. All mea-  Fio  Delivered by Elisée 350
                                                                  2
            surements were repeated with a second OC.          Operating With an OC
                                                               The Fio  delivered by the Elisée 350 ranged from a mini-
                                                                     2
            The difference in Fio  delivered by the two ventilators   mum of 21% to a maximum of 89% when the ventila-
                              2
            was less than 10% at each setting. Therefore, the values   tor operated with an OC oxygen source from 0.5L/min
            were averaged for analysis.                        to 10L/min (Table 3, Figure 2).
            Statistical Analysis                               Effects of OC Flow on Delivered Fio 2
            Fio  values are expressed as mean ± standard deviation   Increase in OC oxygen flow led to an increase in de-
               2
            (SD). Comparisons between delivered Fio  at a given OC   livered Fio  when minute ventilation remained constant
                                               2
                                                                        2
            oxygen flow and ventilator parameters were compared   (Table 3, Figure 2). At a constant minute ventilation of
            by using a Student t test. An analysis of covariance was   6L/min (500mL; rate, 12), delivered Fio  ranged from
                                                                                                  2
            used to determine factors independently affecting deliv-  22.8% at OC flow of 0.5L/min to 79.3% at OC flow
            ered Fio . All analyses were performed with SPSS 20.0   of 10L/min.
                   2
            (IBM Corp.; http://www-01.ibm.com); p-values less than
            .05 were considered statistically significant.     Effects of Respiratory Rate on Delivered Fio 2
                                                               Increasing respiratory rate, when tidal volume and OC
                                                               oxygen flow remained constant, reduced delivered Fio
            Results                                                                                           2
                                                               (Table 3, Figure 2). As a result, increase in minute venti-
            A total of 1,200 measurements were performed. There   lation resulted in decreased delivered Fio . At a constant
                                                                                                  2
            was less than 5% difference in Fio  delivered by the    OC  flow  of  10L/min,  delivered  Fio   decreased  from
                                            2
                                                                                               2
            two ventilators or OC at each OC oxygen flow tested   88.5% at a minute ventilation of 4L/min to 56.8% at a
            with  same  positive  end-expiratory  pressure  (PEEP),   minute ventilation of 13L/min.
            Table 3  Delivered Fraction of Inspired Oxygen in Various Minute Ventilation and OC Flow Conditions
                                                            Minute Volume (L/min)
             OC Flow (L/min)    4          5         6          7         8         9         10         13
                   0.5         23.5       23.5      22.8      23.0       23.0      21.3       21.0      21.0
                   1           32.7       30.3      28.3      28.0       27.3      24.0       24.0      23.0
                   2           43.3       37.7      35.0      33.0       32.5      31.8       31.0      30.0
                   3           53.5       44.8      41.0      38.8       37.3      36.0       35.3      33.5
                   4           63.5       53.5      47.3      44.5       42.5      40.5       39.8      37.8
                   5           72.8       61.3      53.8      49.8       48.0      45.5       44.0      41.0
                   6           79.3       68.3      59.5      55.5       53.0      50.0       48.0      44.3
                   7           84.5       74.0      65.0      60.0       57.3      54.3       52.3      48.0
                   8           87.3       79.0      70.0      66.5       62.0      58.0       56.0      51.0
                   9           89.0       82.8      75.0      71.0       66.3      60.8       58.5      53.0
                   10          88.5       84.3      79.3      75.5       69.0      65.5       62.3      56.8
            Fio  = fraction of inspired oxygen; OC = oxygen concentrator.
              2

            32                                        Journal of Special Operations Medicine  Volume 15, Edition 3/Fall 2016