
Page 43 - Journal of Special Operations Medicine - Fall 2016
P. 43
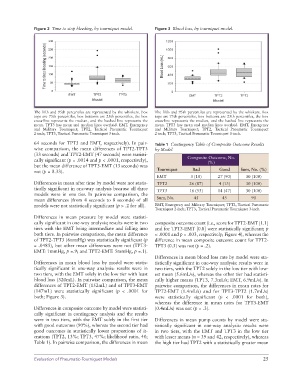
Figure 2  Time to stop bleeding, by tourniquet model.  Figure 3  Blood loss, by tourniquet model.


               The fifth and 95th percentiles are represented by the whiskers. Box   The fifth and 95th percentiles are represented by the whiskers. Box
               tops are 75th percentiles, box bottoms are 25th percentiles, the box   tops are 75th percentiles, box bottoms are 25th percentiles, the box
               cross-line represents the median, and the hashed line represents the   cross-line represents the median, and the hashed line represents the
               mean. TPT3 has mean and median lines overlaid. EMT, Emergency   mean. TPT3 has mean and median lines overlaid. EMT, Emergency
               and Military Tourniquet; TPT2, Tactical Pneumatic Tourniquet   and Military Tourniquet; TPT2, Tactical Pneumatic Tourniquet
               2-inch; TPT3, Tactical Pneumatic Tourniquet 3-inch.  2-inch; TPT3, Tactical Pneumatic Tourniquet 3-inch.

               64 seconds for TPT3 and EMT, respectively). In pair-  Table 1  Contingency Table of Composite Outcome Results
               wise comparison, the mean differences of TPT2-TPT3   by Model
               (33 seconds) and TPT2-EMT (47 seconds) were statisti-
               cally significant (p = .0014 and p < .0001, respectively),       Composite Outcome, No.
                                                                                         (%)
               but the mean difference of TPT3-EMT (13 seconds) was
               not (p = 0.33).                                     Tourniquet     Bad         Good     Sum, No. (%)
                                                                   EMT           3 (10)      27 (90)     30 (100)
               Differences in mean after time by model were not statis-  TPT2    26 (87)     4 (13)      30 (100)
               tically significant in one-way analysis because all three   TPT3  16 (53)     14 (47)     30 (100)
               models were in one tier. In pairwise comparison, the
               mean differences (from 4 seconds to 8 seconds) of all   Sum, No.    45          45          90
               models were not statistically significant (p > .2 for all).  EMT, Emergency and Military Tourniquet; TPT2, Tactical Pneumatic
                                                                  Tourniquet 2-inch; TPT3, Tactical Pneumatic Tourniquet 3-inch.
               Differences  in  mean  pressure  by  model  were  statisti-
               cally significant in one-way analysis; results were in two   composite outcome count (i.e., score for TPT2-EMT [1.1]
               tiers with the EMT being intermediate and falling into   and for TPT3-EMT [0.8] were statistically significant; p
               both tiers. In pairwise comparison, the mean difference   < .0001 and p = .003, respectively; Figure 4), whereas the
               of TPT2-TPT3 (6mmHg) was statistically significant (p   difference in mean composite outcome count for TPT2-
               = .0485), but other mean differences were not (TPT3-  TPT3 (0.3) was not (p = .2).
               EMT: 1mmHg, p =.9; and TPT2-EMT: 5mmHg, p =.1).
                                                                  Differences in mean blood loss rate by model were sta-
               Differences  in mean  blood loss  by  model  were  statis-  tistically significant in one-way analysis: results were in
               tically significant in one-way analysis: results were in   two tiers, with the TPT2 solely in the low tier with low-
               two tiers, with the EMT solely in the low tier with least   est mean (5.6mL/s), whereas the other tier had statisti-
               blood loss (320mL). In pairwise comparison, the mean   cally higher means (TPT3, 7.3mL/s; EMT, 6.9mL/s). In
               differences of TPT2-EMT (152mL) and of TPT3-EMT    pairwise comparison, the differences in mean rates for
               (147mL) were  statistically significant  (p < .0001 for   TPT2-EMT (1.4mL/s) and for TPT3-TPT2 (1.7mL/s)
               both; Figure 3).                                   were statistically significant (p < .0001 for both),
                                                                  whereas the difference in mean rates for TPT3-EMT
               Differences in composite outcome by model were statisti-  (0.4mL/s) was not (p = .3).
               cally significant in contingency analysis and the results
               were in two tiers, with the EMT solely in the first tier   Differences in mean pump counts by model were sta-
               with good outcomes (90%), whereas the second tier had   tistically significant in one-way analysis: results were
               good outcomes in statistically lower proportions of it-  in two tiers, with the EMT and TPT3 in the low tier
               erations (TPT2, 13%; TPT3, 47%; likelihood ratio, 40;   with lesser means (n = 39 and 42, respectively), whereas
               Table 1). In pairwise comparison, the differences in mean   the high tier had TPT2 with a statistically greater mean


               Evaluation of Pneumatic-Tourniquet Models                                                        25