
Page 102 - JSOM Winter 2023
P. 102
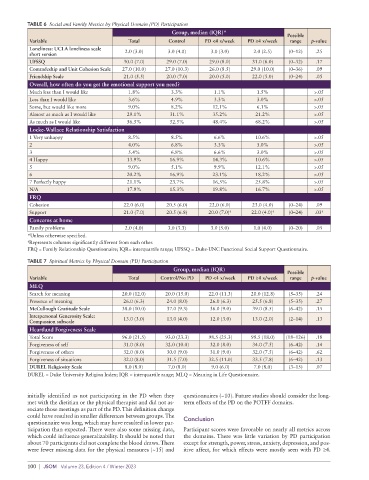
TABLE 6  Social and Family Metrics by Physical Domain (PD) Participation
                                                         Group, median (IQR)*
                                                                                               Possible
           Variable                        Total        Control     PD <4 x/week  PD ≥4 x/week  range  p-value
           Loneliness: UCLA loneliness scale
           short version                  2.0 (3.0)     3.0 (4.0)     3.0 (3.0)     2.0 (2.5)  (0–12)   .25
           UFSSQ                         30.0 (7.0)    29.0 (7.0)    29.0 (8.0)    31.0 (6.0)  (0–32)   .17
           Comradeship and Unit Cohesion Scale   27.0 (10.0)  27.0 (10.3)   26.0 (8.5)  29.0 (10.0)  (0–36)  .09
           Friendship Scale              21.0 (5.5)    20.0 (7.0)    20.0 (5.0)    22.0 (5.0)  (0–24)   .05
           Overall, how often do you get the emotional support you need?
           Much less than I would like     1.8%          3.3%          1.1%          1.5%               >.05
           Less than I would like          3.6%          4.9%          3.3%          3.0%               >.05
           Some, but would like more       9.0%          8.2%         12.1%          6.1%               >.05
           Almost as much as I would like  29.1%        31.1%         35.2%         21.2%               >.05
           As much as I would like        56.5%         52.5%         48.4%         68.2%               >.05
           Locke-Wallace Relationship Satisfaction
           1 Very unhappy                  8.5%          8.5%          6.6%         10.6%               >.05
           2                               4.0%          6.8%          3.3%          3.0%               >.05
           3                               5.4%          6.8%          6.6%          3.0%               >.05
           4 Happy                        13.9%         16.9%         14.3%         10.6%               >.05
           5                               9.0%          5.1%          9.9%         12.1%               >.05
           6                              20.2%         16.9%         23.1%         18.2%               >.05
           7 Perfectly happy              21.1%         23.7%         16.5%         25.8%               >.05
           N/A                            17.9%         15.3%         19.8%         16.7%               >.05
           FRQ
           Cohesion                      22.0 (6.0)    20.5 (6.0)    22.0 (6.0)    23.0 (4.0)  (0–24)   .09
           Support                       21.0 (7.0)    20.5 (6.8)    20.0 (7.0) †  22.0 (4.0) †  (0–24)  .03 †
           Concerns at home
           Family problems                2.0 (4.0)     3.0 (3.3)     3.0 (5.0)     1.0 (4.0)  (0–20)   .05
          *Unless otherwise specified.
          † Represents columns significantly different from each other.
          FRQ = Family Relationship Questionnaire; IQR= interquartile range; UFSSQ = Duke-UNC Functional Social Support Questionnaire.

          TABLE 7  Spiritual Metrics by Physical Domain (PD) Participation
                                                          Group, median (IQR)
                                                                                               Possible
           Variable                        Total     Control/No PD  PD <4 x/week  PD ≥4 x/week  range  p-value
           MLQ
           Search for meaning            20.0 (12.0)   20.0 (15.0)   22.0 (11.3)   20.0 (12.8)  (5–35)  .24
           Presence of meaning           26.0 (6.3)    24.0 (8.0)     26.0 (6.3)   25.5 (6.8)  (5–35)   .27
           McCullough Gratitude Scale    38.0 (10.0)   37.0 (9.3)     36.0 (9.0)   39.0 (8.5)  (6–42)   .15
           Interpersonal Generosity Scale:
           Compassion subscale           13.0 (3.0)    13.0 (4.0)     12.0 (3.0)   13.0 (2.0)  (2–14)   .13
           Heartland Forgiveness Scale
           Total Score                   96.0 (21.5)   93.0 (23.3)   98.5 (25.3)   99.5 (18.0)  (18–126)  .18
           Forgiveness of self           31.0 (8.0)    32.0 (10.0)    32.0 (8.0)   34.0 (7.5)  (6–42)   .14
           Forgiveness of others         32.0 (8.0)    30.0 (9.0)     31.0 (9.0)   32.0 (7.5)  (6–42)   .62
           Forgiveness of situations     32.0 (8.0)    31.5 (7.0)    32.5 (11.0)   33.5 (7.8)  (6–42)   .13
           DUREL Religiosity Scale        8.0 (8.0)     7.0 (8.0)     9.0 (6.0)     7.0 (8.0)  (3–15)   .07
          DUREL = Duke University Religion Index; IQR = interquartile range; MLQ = Meaning in Life Questionnaire.


          initially identified as not participating in the PD when they   questionnaires (~10). Future studies should consider the long-
          met with the dietitian or the physical therapist and did not as-  term effects of the PD on the POTFF domains.
          sociate those meetings as part of the PD. This definition change
          could have resulted in smaller differences between groups. The   Conclusion
          questionnaire was long, which may have resulted in lower par-
          ticipation than expected. There were also some missing data,   Participant scores were favorable on nearly all metrics across
          which could influence generalizability. It should be noted that   the  domains. There  was  little  variation  by  PD  participation
          about 70 participants did not complete the blood draws. There   except for strength, power, stress, anxiety, depression, and pos-
          were fewer missing data for the physical measures (~15) and   itive affect, for which effects were mostly seen with PD ≥4.

          100  |  JSOM   Volume 23, Edition 4 / Winter 2023